


Search for webinar statistics and you’ll find pages promising 40, 60, even 159 of them. Read a few and something odd happens. The same numbers show up credited to different sources, some change meaning from page to page, and a surprising number don’t hold up when you follow the link.
That matters, because you’re probably about to make a decision with one of them.
So every statistic below comes from a published report with a stated sample, named where you read it. Where good sources disagree, you get the range and the reason. Each section ends with what to do about it, and the last one covers the widely shared webinar statistics that don’t survive being checked.
Key webinar statistics for 2026
50%
of registrants attend live on average (44 to 60%, depending on the source)
60%
watch live or on replay, roughly (57 to 61% across sources)
102
live attendees in the average webinar; 71% of webinars draw fewer than 100
22 min
into a session, viewers start dropping off
22%
of attendees act on an in-session call to action
27%
higher live attendance when hosts send three reminders
Sources: Contrast, Univid, Livestorm, TwentyThree and ON24
Table of contents
- Where these webinar benchmarks come from
- How many people watch webinars?
- Webinar attendance statistics
- Webinar timing statistics
- Webinar engagement statistics
- Webinar conversion statistics
- Webinar ROI and lead quality statistics
- What’s a webinar worth to you?
- Webinar email and promotion statistics
- Webinar statistics that don’t survive checking
- Common questions
Where these webinar benchmarks come from
Only primary sources made the cut: organizations reporting their own platform data or surveys from roughly the last two years, with a visible sample.
| Source | Sample | Published |
|---|---|---|
| Contrast | 1M+ registrants; survey of 524 B2B marketers | May 2026 |
| Univid | 2,000+ webinars; 325,000+ attendees and hosts | 2026 |
| Livestorm | 33,786 sessions; 7M+ registrations | 2026 report, 2025 data |
| ON24 | Its enterprise customers’ webinars | 2026 report, 2025 data |
| TwentyThree | Its own platform data and survey | 2026 |
| Content Marketing Institute | Annual survey of B2B marketers | October 2024 |
Each platform measures its own customers. ON24 serves large enterprises, while Contrast and Univid serve many B2B software companies. That’s why their numbers differ, and why a range is usually more honest than a single figure.
How many people watch webinars?
Fewer than most people assume.
- The average webinar has 102 live attendees, and 71% draw fewer than 100 (Univid).
- Average webinar registrants: 128 on Contrast and 175 on Livestorm.
- Enterprise programs run bigger: 239 attendees on average on ON24 in 2025, up 11%.
- 91% of webinars are delivered live (Contrast).
What to do with it
Don’t benchmark against enterprise averages. For a course creator or coach, 50 to 100 people is normal, and smaller rooms have the highest attendance rates.
Webinar attendance statistics
The average webinar attendance rate is about half of registrants.
| Source | Live attendance rate |
|---|---|
| Contrast | 44 to 50%, by day and time |
| Livestorm | 47.7% |
| Univid | 49% |
| TwentyThree | 58% |
| ON24 (enterprise) | 60% |
Including replays, 61% of registrants watch on Contrast and 57% on Univid. The sources split on on-demand viewing, though: 42% of views are on-demand on Contrast, while most viewing on Univid happens live.
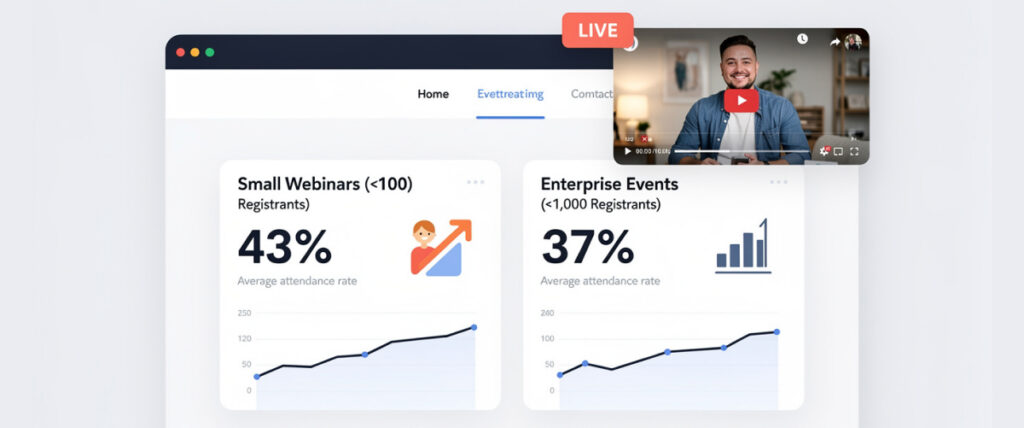
Why live attendance rates differ by source: audience and arithmetic. ON24’s enterprise programs run heavy reminder sequences. And because smaller webinars get higher show-up rates, averaging each webinar’s rate gives a higher number than dividing total attendees by total registrants. On Contrast, webinars under 100 registrants get about 6% higher attendance, while those over 1,000 average 37%.
The older “35 to 45%” figure no longer reflects current platform data.
Reminders move it most. Hosts send two reminders on average, but those sending three (a day before, an hour before and five minutes before) see 27% higher live attendance (Contrast).
What to do with it
Aim for about 50% live. Below 40%, fix reminders and timing before spending more on promotion. Judge results on live plus replay, too, since on-demand webinars and replays deserve the same follow-up as the live session. In WebinarJam, only the signup confirmation and a 15-minute reminder are switched on by default, so add the day-before and hour-before reminders yourself. More in our guide to increasing webinar attendance.
Webinar timing statistics
Timing is where webinar statistics are easiest to misread, because the best time depends on where your audience lives.
Best time
2PM in Contrast’s data (53 to 55%, as the page reports both) and 3PM in Univid’s. But most of Contrast’s 2PM sessions ran in Central European Time, which is 8AM Eastern.
Best days to host a webinar
Tuesday on Contrast and Wednesday on Univid. Thursday webinars draw the most registrations per event (Contrast).
Session length
60 minutes is the most common length at 37% of webinars (Univid) and draws the most registrations (Contrast). 90-minute webinars had the highest live attendance, at 67 to 72%.
When people register
49% in the final week and 14% on the day itself (Contrast).
What to do with it
For a US audience, test late morning to early afternoon Eastern rather than copying “2PM.” Promote hardest in the final week, including on the day.
Webinar engagement statistics
Of all the webinar engagement statistics, the ones that predict who acts at the end matter most.
- Viewers start dropping off around minute 22, and only 37% finish a 60-minute webinar (Contrast).
- ON24’s enterprise audiences average 49 minutes of watch time.
- 46% of webinars use polls on Contrast. On Univid, 40% use polls, 63% use chat and 49% run Q&A sessions.
The strongest finding is Univid’s. Webinars averaging 0 to 1 reactions per attendee converted under 20% on their calls to action, while those averaging 5 to 10 converted 69%. That’s a correlation, since interested people both engage and buy more, but the gap is too big to ignore.
What to do with it
Put your strongest moment before minute 22 and run a poll early. Track your engagement rate, meaning the share of attendees who interact through polls, chat, questions or resource downloads, and feed that engagement data into lead scoring. Our guide to polls, offers and handouts covers placing those moments.
Webinar conversion statistics
“Conversion rate” is the most misused term in webinar statistics. On pages ranking for this keyword, the “average webinar conversion rate” appears as 19%, 22%, 56%, 60% and 63%, because each one measures something different.
| What’s being converted | Typical figure | Source |
|---|---|---|
| Visitors into registrants | No reliable benchmark | Vendor figures only |
| Registrants into live attendees | 50 to 60% | Univid, Livestorm, Contrast, ON24 |
| Attendees into CTA clicks | 22% | Univid |
| Attendees into paying customers | No reliable public benchmark | n/a |
Registration page conversion sets your registration rates, but the figures that circulate, from about 20% to 60%, mostly come from vendors describing their own pages.
In-session CTA clicks average 22% on Univid, and two calls to action converted 25% of attendees, above the 22% average, the best-performing number in its data.
Attendee-to-customer conversion has no trustworthy public figure, so measure your own.
What to do with it
Always say which conversion you mean, track each stage separately, and use one strong call to action plus at most one secondary option. If yours isn’t landing, check these common webinar conversion mistakes.
Webinar ROI and lead quality statistics
- B2B marketers rate webinars the second most effective content distribution channel at 51%, behind in-person events at 52%, in the Content Marketing Institute’s 2025 report, published October 2024. CMI’s 2026 edition doesn’t include the question.
- Educational webinars generate 53% more ROI than product demos (Contrast survey). Customer story webinars rank second, yet only 18% of marketers run them.
- 77% integrate their webinars with a CRM (Contrast), and 68% repurpose webinar content into clips and articles (TwentyThree).
- Only 12% of marketers track revenue as their main webinar metric, while 39% track leads (Contrast survey).
Data on webinar cost is thin. The widely quoted $72 cost per lead traces back to a single software vendor’s blog post.
What to do with it
Run more educational webinars and customer stories, and close the measurement gap with webinar analytics connected to your CRM. In WebinarJam, integration rules fire when someone attends, misses the session, leaves early, stays to the end, watches the replay or buys. Our guide to webinar lead generation turns that behavior into a lead scoring model.
What’s a webinar worth to you?
Enter your own numbers to see what one webinar brings in after the cost of WebinarJam Basic. Use your own conversion rate: as the conversion section shows, there’s no reliable public benchmark for how many attendees buy.
What could your next webinar bring in?
Type in your own numbers. The result updates as you go.
The average webinar has 102 (Contrast).
Share of live attendees who buy.
Revenue per webinar after WebinarJam Basic
$2,883
$2,982 in sales minus the $99/mo Basic plan
Gross sales before ads, payment fees, refunds and taxes, running one webinar a month. Basic is $99/mo, WebinarJam’s standard monthly rate as listed in October 2026.
Run your next webinar on WebinarJam
Pop-up offers, countdown timers and email reminders are built in.
Webinar email and promotion statistics
On promotion, the webinar marketing statistics agree.
- 91% of B2B marketers name marketing emails as their top channel for high-quality leads. Paid ads and communities trail at 11% (Contrast survey).
- 78% of people register on a desktop (Contrast).
- Gmail on a phone shows 37 characters of a subject line, and Apple Mail on an iPad just 31 (BuzzStream 2026).
What to do with it
Email your own list first, and price paid traffic to your webinar on attendees rather than registrations. Keep your subject line’s hook inside 40 characters, and judge invitations on registrations rather than opens. More in webinar invitation subject lines.
Webinar statistics that don’t survive checking
Several of these appear on pages ranking for “webinar statistics” right now.
| The claim | Why it doesn’t hold up |
|---|---|
| “The average webinar conversion rate is 56%.” | That’s ON24’s 2024 rate of registrants who attended, not people who bought. |
| “73% of B2B marketers say webinars generate the best-quality leads.” | The citation trail ends at a lead-generation agency’s homepage, not a study. |
| “Engaged attendees are 30% more likely to convert.” | Credited to a statistics roundup. Univid’s own data shows a similar pattern with very different numbers. |
| “47% of webinar attendees become leads.” | One roundup credits this to GoToWebinar, dated 2021, with no linked study. |
| “A 41.6% median attendance rate across 12,400 webinars.” | Credited to pooled ON24, GoTo and BrightTALK data on one page and to Contrast on another. It isn’t on Contrast’s own statistics page. |
| “Evergreen webinars get 60 to 70% attendance.” | The link behind it goes to one marketing consultant’s blog post. |
| Webinar market sizes from $134 billion to over $1 trillion | These figures describe the whole virtual events industry, not webinars. |
To check any statistic yourself: click through to the original source, check the year of the data rather than the year in the headline, and check exactly what’s being measured.
Common questions
What is the average webinar conversion rate?
It depends which conversion you mean. About 50 to 60% of registrants attend live, and about 22% of attendees act on an in-session call to action (Univid). There’s no reliable public benchmark for attendees who become paying customers.
How many people watch webinars?
The average webinar draws 102 live attendees, and 71% of webinars have fewer than 100 (Univid). Around 60% of registrants watch live or on replay.
What is a good webinar attendance rate?
About 50% of registrants attending live is typical, with enterprise programs reaching 60%. Below 40%, start with your reminders and your timing.